
You may be wondering how you can customize your Wellness Reports even more. Maybe you want a numerical score rather than a letter grade or would like to see more colors on your grades to elicit a more emotional response from your patient in response to the information you are presenting to them. The Wellness Score is designed in a way that allows those changes to be possible through our Report Settings, which we will outline below:
Click the Self Help button to use the Cash Practice® walkthrough when logged into your account

Getting started:
Step 1: Head to the [Systems] menu → select [The Wellness Score®] → [Setup] → [Report Settings].

Step 2: Review the Settings: If any changes were made, click the [Save] button at the bottom of the screen.
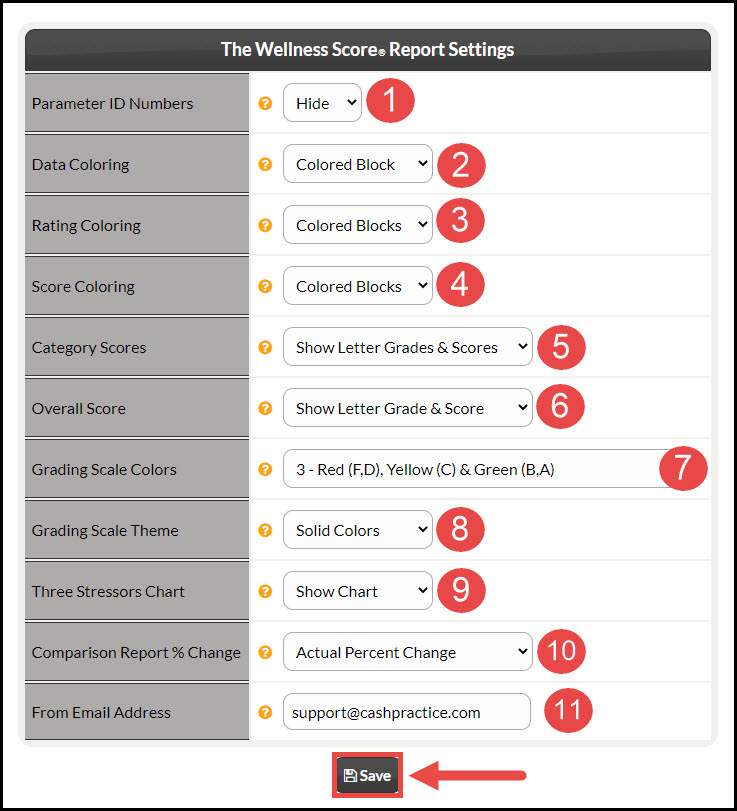
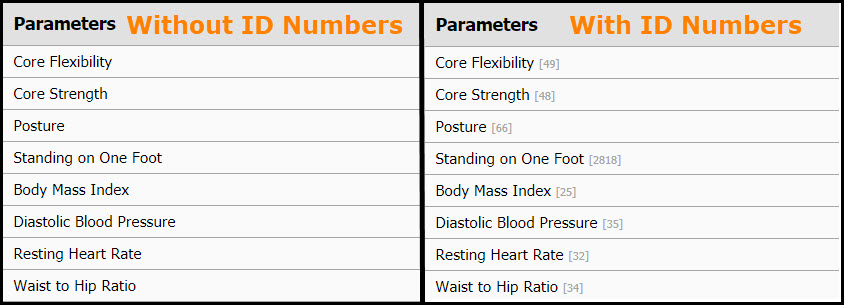
1. Parameter ID Numbers: Each Parameter is given an ID number when added to your Cash Practice® account as an identifier. These have no weight in an overall score.
- Options:
- Show
- Hide
2. Data Coloring (Page 1):
- Options:
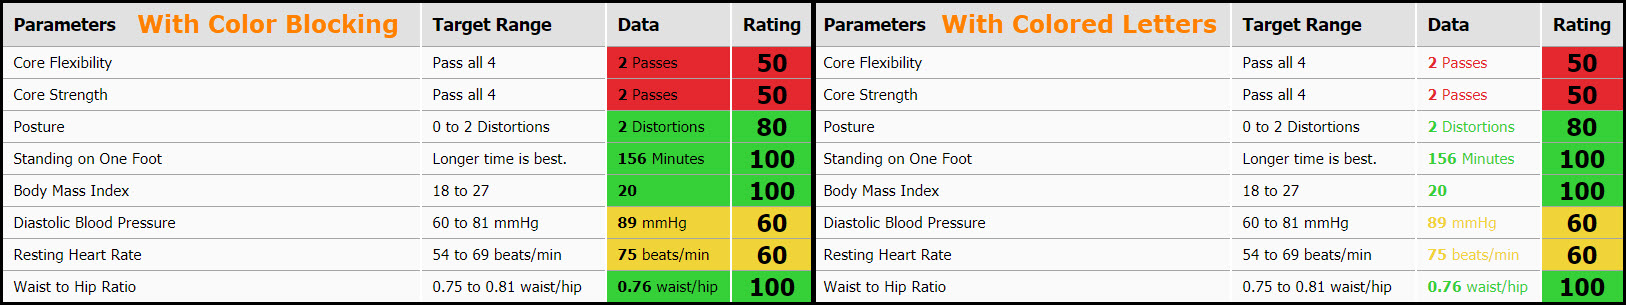
- Data Color Blocking: Color blocks the entire Data column
- Data Colored Letters: Adds the corresponding color to just the lettering in the Data column
3. Rating Coloring (Page 1):
- Options:
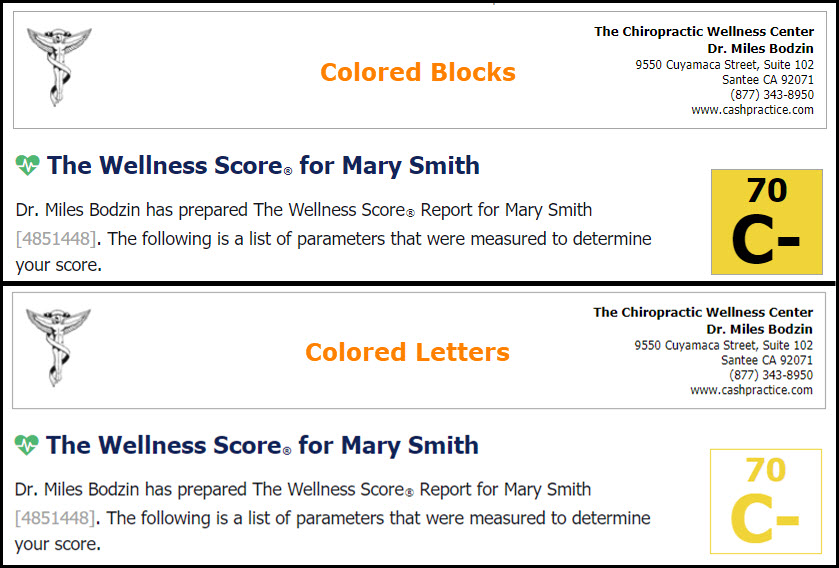
- Colored Blocks: Displays the Rating as one solid block of color along with the Data column
- Colored Letters: This shows the Rating column with corresponding colored numbers
- Hide: This setting hides the Rating column from the view

4. Score Coloring (Page 1 & 2)
- Options:
- Colored Blocks
- Colored Letters
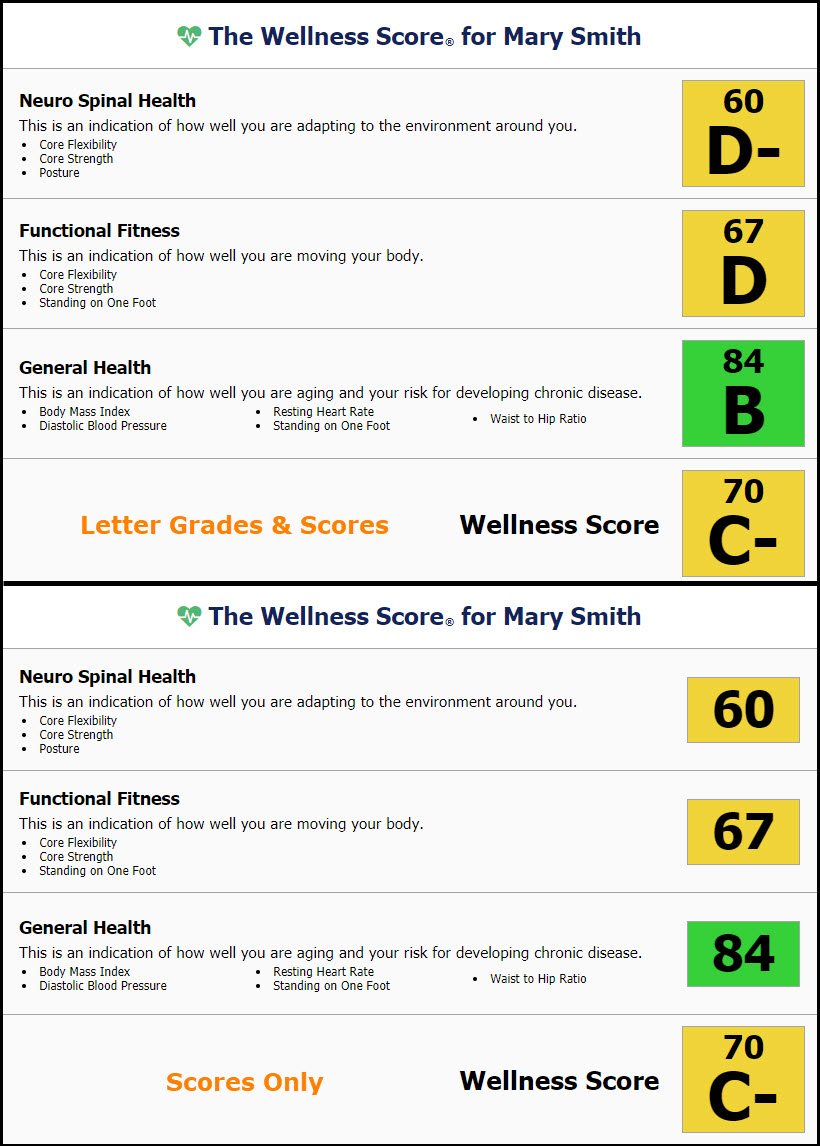
5. Category Scores (Page 2):
- Options:
- Show Letter Grades & Scores
- Show Scores Only
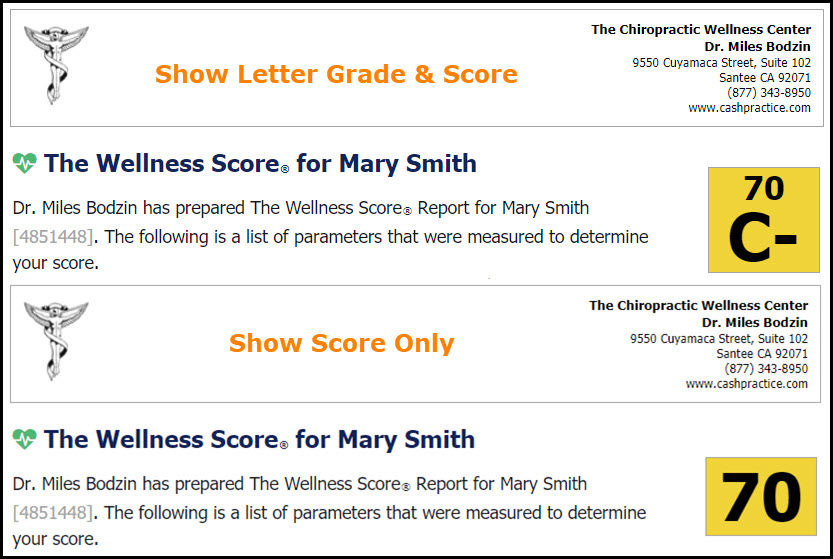
6. Overall Score (Page 1 & 2):
- Options:
- Show Letter Grade & Score
- Show-Score Only
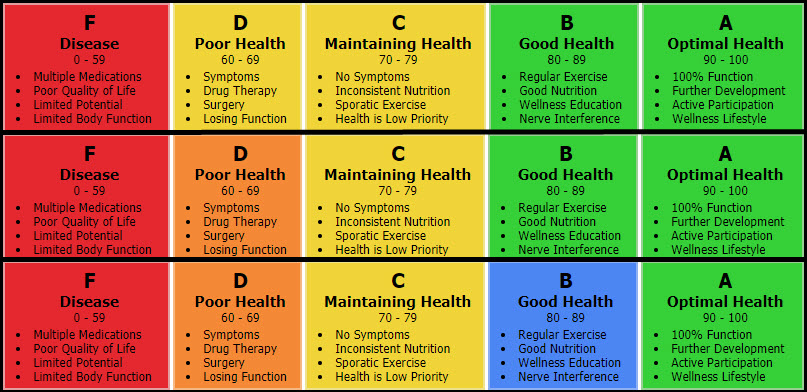
7. Grading Scale Colors (Pages 1, 2, & 3):
- Options:
- 3 (Colors) - Red (F, D), Yellow (C), & Green (B, A)
- 4 (Colors) - Red (F), Orange (D), Yellow (C), & Green (B, A)
- 5 (Colors) - Red (F), Orange (D), Yellow (C), Blue (B), & Green (A)
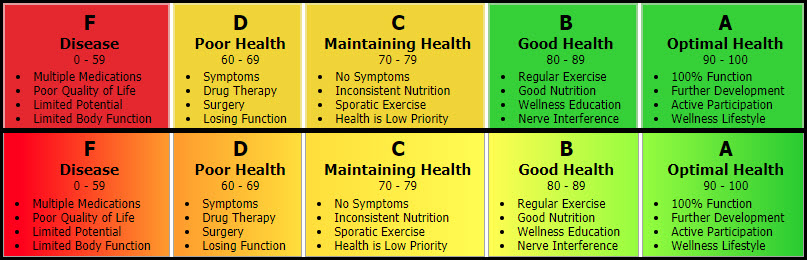
8. Grading Scale Theme (Page 3):
- Options:
- Solid Colors
- Gradient Colors
- Hide
9. Three Stressors Chart (Page 3):
- Options:
- Show Chart
- Hide Chart

10. Comparison Report % Change:
- Actual Percent Change - When comparing reports, the percent change will be the actual amount of change. For example, if the score changed from 20 to 90, the calculation would be ((90 - 20) / 20) x 100 = 350% improvement.
- Max 100% Change - When comparing reports, the percent change will be calculated so the max would be no more than 100%. For example, if the score changed from 20 to 100, the calculation would be ((90 - 20) / (100 - 20) x 100 = 88% improvement.
11. From Email Address: This is the email address the reports are emailed from. By default, the setting is %Email% which inserts the Admin email on file. If you would like to change this, enter a different email address here.
Make sure to SAVE all changes made to the Report Settings, so they are accurately reflected on your Wellness Reports.