
Step 1: Hover over the [Systems] menu → [The Wellness Score®] → click [Setup] → Select [WS Settings].

Step 2: From the [Parameters (Measured)] tab → Click on the [Parameters] sub-tab → In the [Add New Parameter] field, enter the name of the Parameter and click the [Save] icon.

Please note: In order to use the parameter, you must edit the Parameter information and create a data table and assign it to a category.
Step 3: The page will reload showing the new Parameter has been saved.
Adding in Parameter Information and Data:
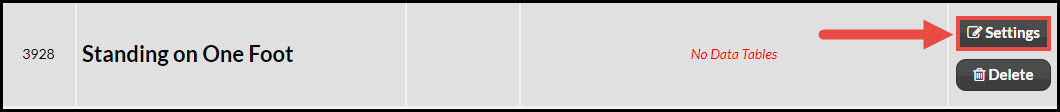
Step 4: Locate the new Parameter in the list → click the [Settings] button. This will load the [Parameter Info] window.
Step 5: Enter Parameter info based upon the data that you have:

- Name: The name of your Parameter will show here. You can change the name of the Parameter if you choose.
- Exam Type: Select the type of exam from the drop-down menu.
- The options are:
- Physical Exam
- Radiology
- Objective Assessment Tool
- Subjective Assessment Tool
- Blood Labs
- Urine Labs
- Saliva Labs
- Other
- The options are:
- Title: (Optional) Use this title to give a more detailed explanation of the parameter name.
- Units: (Optional) Choose to enter in units. Units will show on the Wellness Score® next to the data explaining how the data is measured (i.e. %, inches, mmHg).
- Qualifier: (Optional) Choose to enter a qualifier if you do not want or do not have an ideal range for your data table measurements. If you enter in a qualifier and select an ideal range for your data table, the qualifier will override the ideal range. This will display on your Wellness Exams. If you choose not to set an ideal range when creating your data table, you may use the qualifier to explain the parameter score qualifications (i.e. higher is better, passes all four tests).
- Reference: (Optional, but recommended) Use this section to reference the applicable material you are using to create this parameter's data table.
- Description: (Optional, but recommended) Use this section to explain to your patient what this parameter measures and how it is scored. The description will be printed on the last page of your wellness report and will be seen by your patient.

- Sub Parameters (Not Required): Subparameters allow you to refine a parameter data table by age groups and gender.
- Age group 1, 2, 3, & 4: Should your data have age ranges associated with your parameter, the age range 1, 2, 3, & 4 will allow you the ability to assign the data table to each age range. Keep in mind, you will have the ability to create individual data tables for each age range or group the ages together using each age selector.
- Gender: Should your data have a gender associated with your parameter, you will have the ability to assign the data table to male, female, or both. Remember; you will have the ability to create individual data tables for each gender.
- Data Table
- Measurement Thresholds: Enter the correct threshold associated with the parameter.
- Ratings: Assign the correct rating for the measurement threshold (0-10 scale).
- Ideal: (Optional) Select an ideal range. If you choose not to set an ideal range when creating your data table(s), you may use the qualifier to explain the parameter score qualifications (i.e. higher is better, passes all 4 tests).
 RATINGS
A grade of F would be rated as 0-5
A grade of D would be rated as 6
A grade of C would be rated as 7
A grade of B would be rated as 8
A grade of A would be rated as 9-10
Step 8: Select the [Save] button at the bottom of the page. This will create the completed table.

Step 9: To view the completed data table, select the [Data Tables] tab. The example image above shows the saved Measurement Thresholds, Ratings, and Ideal range (in yellow). We can also see an example of a Qualifier in use, see "Longer time is best".
Step 10: [IMPORTANT NEXT STEP] You must assign the Parameter to a category to then be used in a parameter set. For instructions on how to assign the Parameter to a category click HERE, to learn how to assign the parameter to a set click HERE.